Key Points: First tarsometatarsal joint (TMT1) hypermobility is associated with hallux valgus (HV) which is…
Study Finds 3D WBCT Measurements are Reliable for Hallux Valgus Planning
Key Points
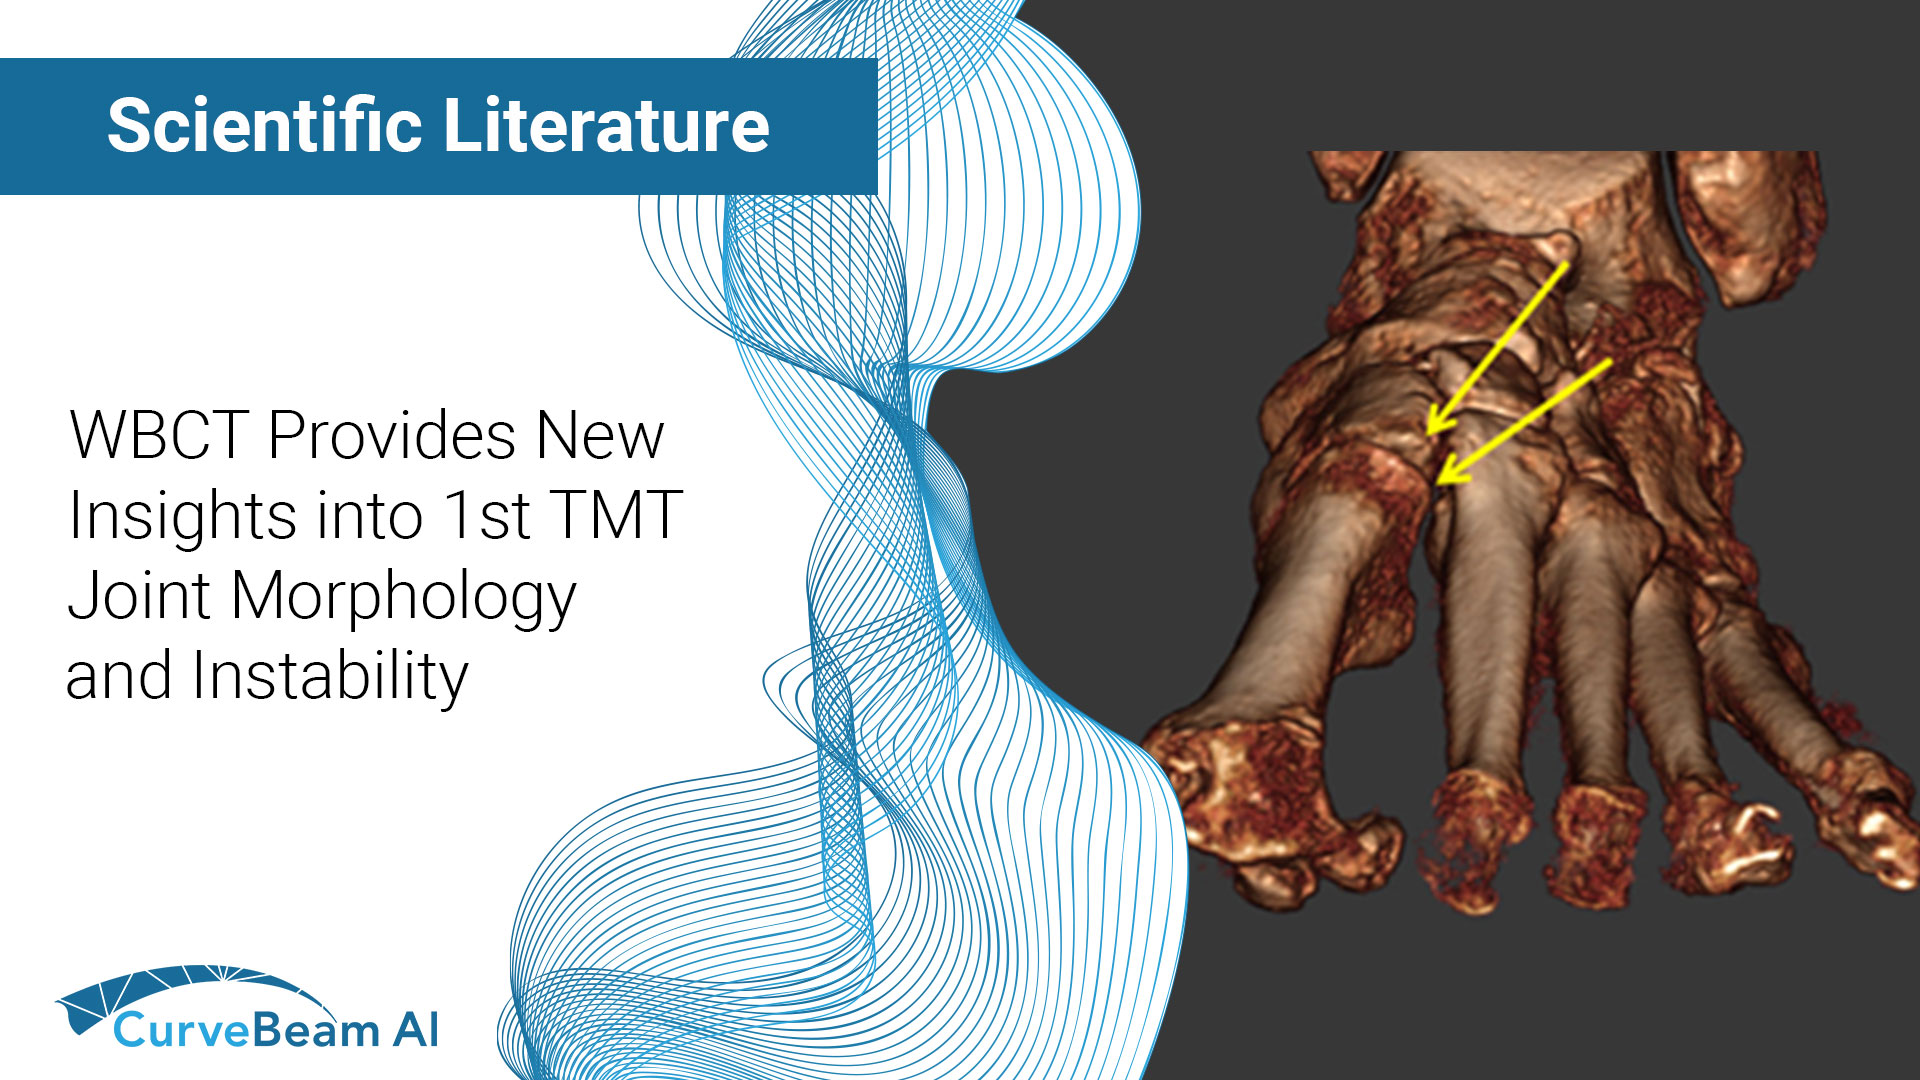
- 2D imaging has limitations for pathology such as Hallux Valgus (HV) as pronation on the sagittal and coronal planes cannot be fully appreciated.
- WBCT 3D measurements can reliably assess multiplanar deformities of the foot and ankle, which is important as severity of an HV deformity often dictates treatment choice.
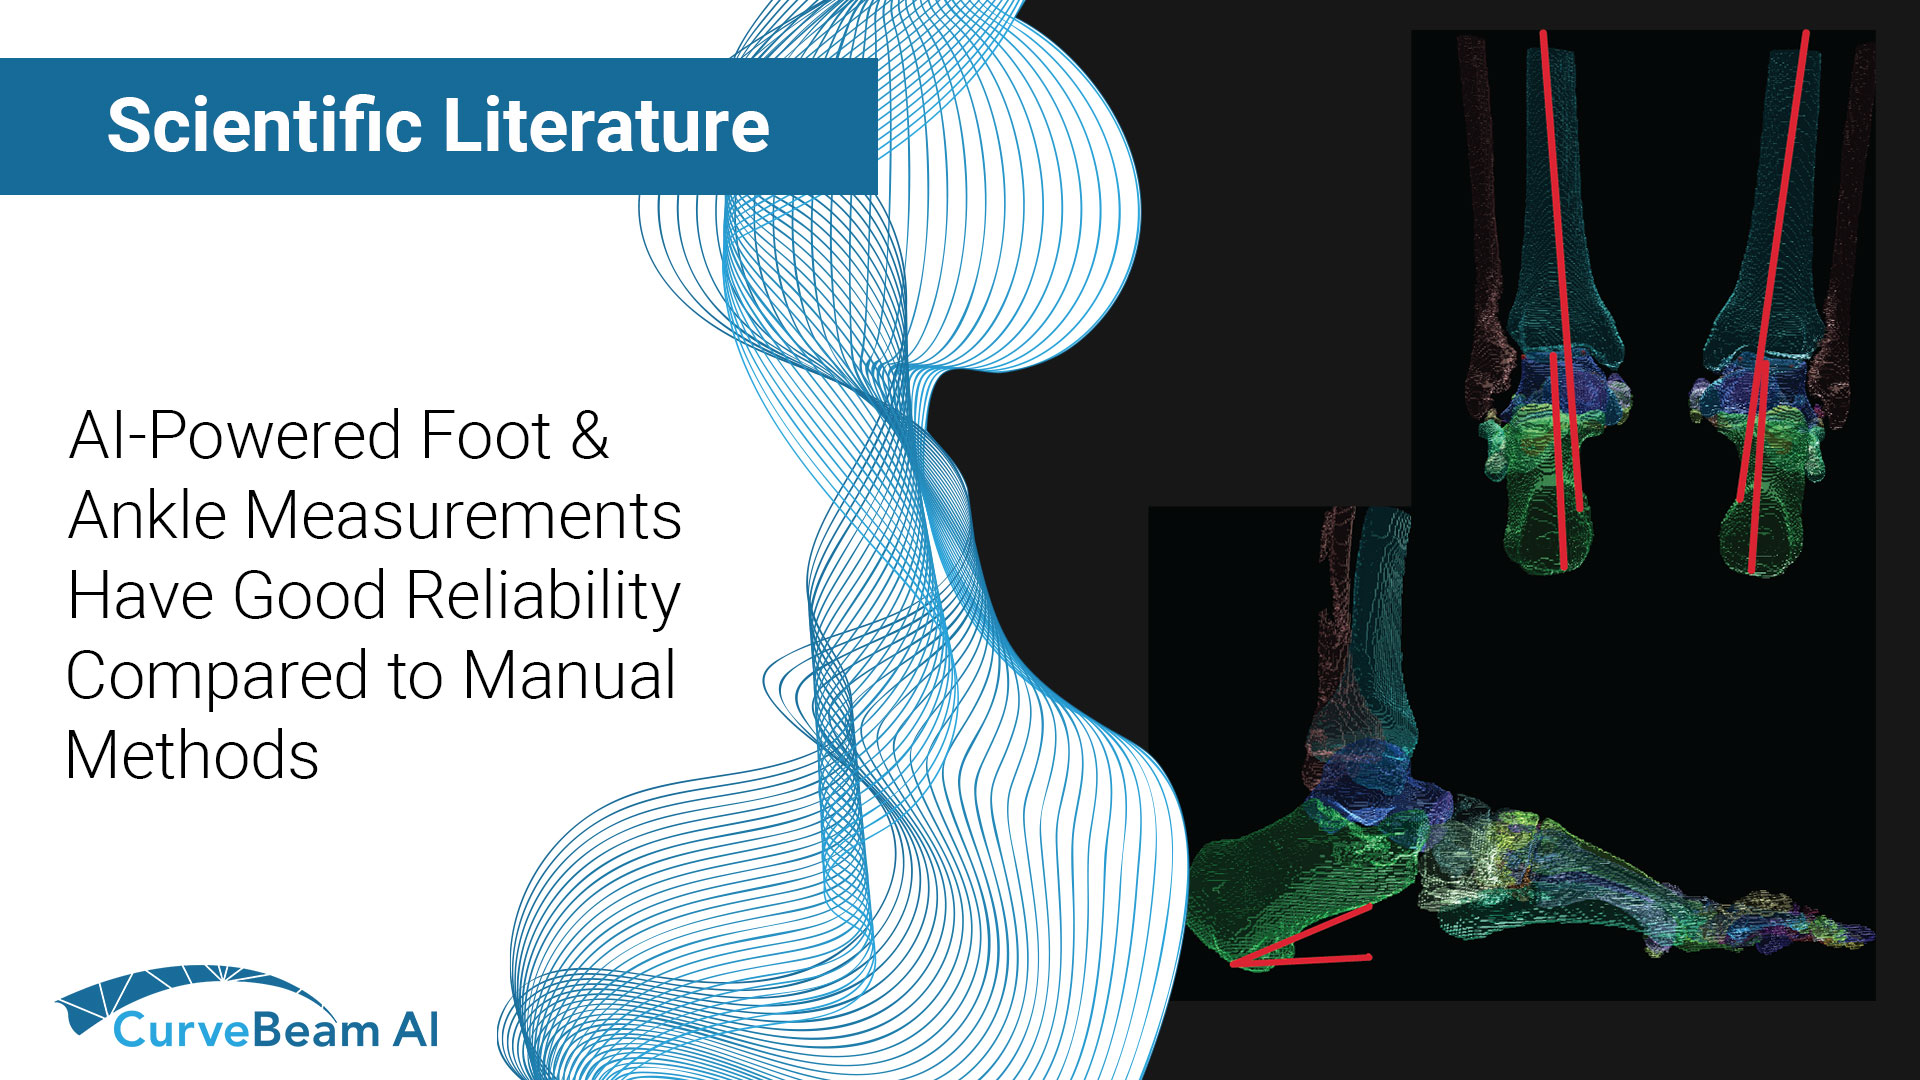
- Automatic measurement tools are a focus for future applications with WBCT
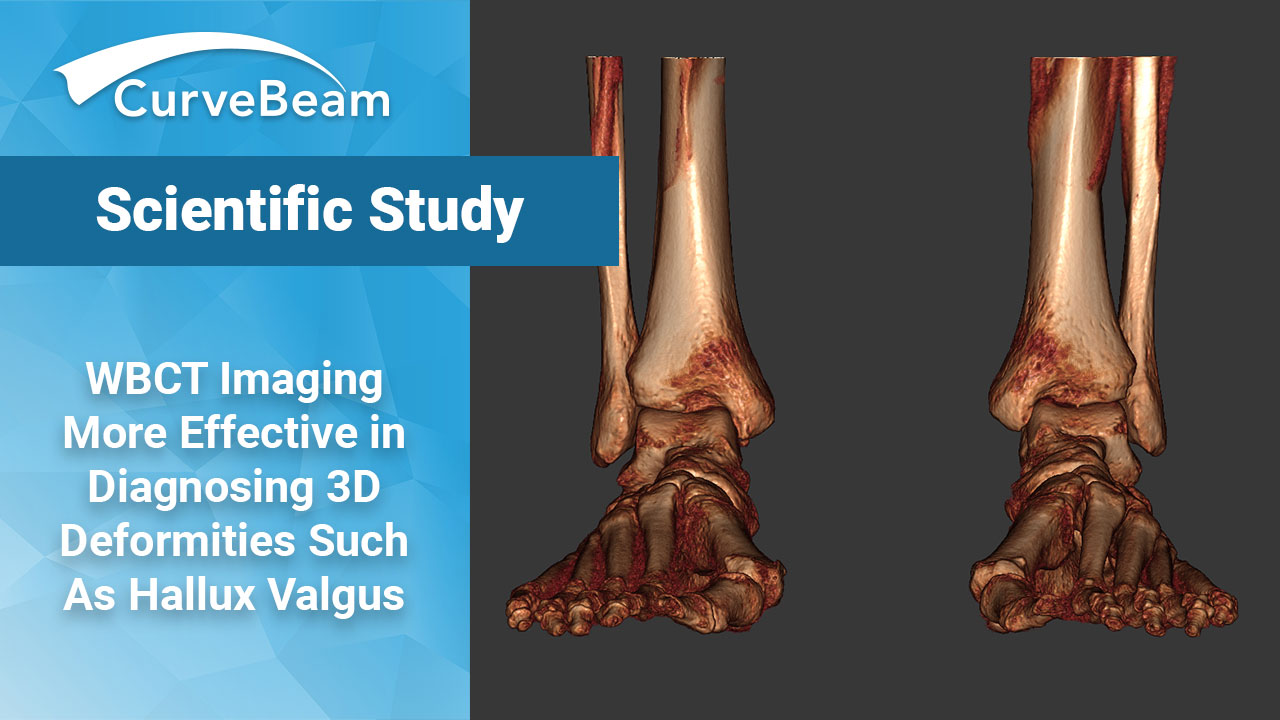
When diagnosing Hallux Valgus (HV) and determining the best surgical approach, preoperative assessment of measurements such as the M1-M2 intermetatarsal angle (IMA) are essential. The IMA is traditionally measured on the dorsal plantar view, a 2-dimensional (2D) ground projection. HV is however a multiplanar deformity which means there are limitations when viewed in 2D. Innovative technology such as CurveBeam’s pedCAT, a weight bearing CT (WBCT) device which produces bilateral 3-dimensional (3D) CT scans, allows for better assessment of foot and ankle pathologies, such as HV.
Dr. Jonathan Day et al. of the Department of Orthopaedic Surgery, Georgetown University Medical Center, Washington, DC, noted that although defining reliable anatomic landmarks in 3 spatial planes may be more difficult than in 2D, he hypothesized that 2D and 3D IMA measurements would correlate and have similar reliability in patients with HV and a control group. The study concluded that measurements for IMA were similar across digitally reconstructed radiographs (DRR), 3D, and 2D projected angles, with very strong intraobserver reliability and moderate to very strong intermethod correlations.
Materials and Methods
The study compared 83 feet (59 patients) WBCT scans, consisting of 41 feet (29 patients) with a diagnosis of HV both clinically and radiographically, and 42 feet (30 patients) that served as controls. Control patients were defined as patients who underwent a WBCT scan as part of routine follow-up for a condition that was not associated with forefoot pathology. All patients were assessed with WBCT in full weight bearing stance using CurveBeam’s pedCAT system. Datasets were analyzed independently by 3 foot and ankle fellowship-trained orthopaedic surgeons using the same protocol.
IMA was measured manually with DRRs. Coordinates in 3 planes (x, y, z) were obtained for the center of the first metatarsal head, center of the second metatarsal head, midpoint of the first metatarsal proximal metaphysis, and midpoint of the second metatarsal proximal metaphysis. These coordinates were used to generate the longitudinal axes of the 2 metatarsals in space (x, y, z) as well as their ground projections (x, y,0). These vectors were used to calculate the 3D-IMA and 2D-IMA, respectively.
To control for bias between HV and controls in 3D-IMA measurements, additional 3D measurements were analyzed including lengths of the first (M1) and second metatarsals (M2), sagittal inclination of the first metatarsal relative to the floor, and sagittal inclination of the first metatarsal relative to the second metatarsal.
Intraclass correlation coefficients (ICCs) were calculated to determine intraobserver reliability. Measurement modalities were compared using bivariate linear regression analysis and intermethod correlation was assessed using Pearson or Spearman correlation coefficiants. 3D-IMA and 2D-IMA measurements were plotted on receiver operating characteristics curves with area under the curve calculations. Measurements in each group were presented as mean values with 95% Cis. Normality of continuous variables was assessed using Shapiro-Wilk tests. Mean values for measurements were compared by 1-way analysis of variance. All calculations were performed with HMP Pro 15.0.0.
Results
There was excellent intraobserver reliability for DRR_IMA (ICC, 0.95) and 3D measurements (ICC, 0.99), with very strong intermethod correlations between 2D and 3D measurements in both the HV (0.91) and control (0.92) groups. Intermethod correlations were moderate in both the HV (DRR vs 2D, 0.48; DRR vs 3D, 0.48) and control (DRR vs 2D, 0.56; DRR vs D, 0.60) groups.
IMA measurements were similar between the 3 measurement modalities in both control and HV groups. The control group demonstrated a mean DRR-IMA of 8.8, mean 3D-IMA of 10.6, and mean 2D-IMA of 9.8 degrees. HV demonstrated significantly increased IMA with a mean DRR-IMA of 13.1, mean 3D-IMA of 13.3 , and mean 2D-IMA of 12.1 degrees. There were no significant differences in mean M1 length, m2length, sagittal inclination of M1 relative to the floor, or M1 relative to M2 in HV vs controls. AUC was significantly similar between 3D-IMA and 2D-IMA.
Conclusion
The study concluded that there was a strong intermethod correlation between 3D and 2D IMA measurements in both HV and controls, with higher intraobserver reliability observed in 3D measurements.
Researchers stated that their findings held several important implications; validation that WBCT 3D measurements can reliably assess multiplanar deformities of the foot and ankle, which is crucial for patients with HV in which the severity of the deformity, in addition to clinical symptoms, dictates the choice of treatment. Although conventional radiographs are useful in demonstrating subluxation of the first metatarsophalangeal joint, pronation in the sagittal and coronal planes may not be fully appreciated in 2D, implying that 2D radiographs may not be sufficient and 3D measurements may be more appropriate. Although moderate to very strong intermethod correlations were observed, there was more variability in the HV group across all 3 comparisons compared to controls which researchers suspected was due to the multiplanar nature of HV that may not be fully appreciated on 2D assessment. AUC was slightly higher for 3D-IMA measurements and while this did not quite reach statistical significance, it does suggest that 3D-IMA is, at minimum, just as useful as 2D-IMA in distinguishing between HV and controls.
It was noted that although the same protocol was used and reproducibility was high, the manual selection of coordinates could be difficult and therefore introduce variability to which researchers suggested a potential future application of WBCT 3D measurements may be to implement software tools to aid in the process of taking complex measurements.
To read the full study click here.
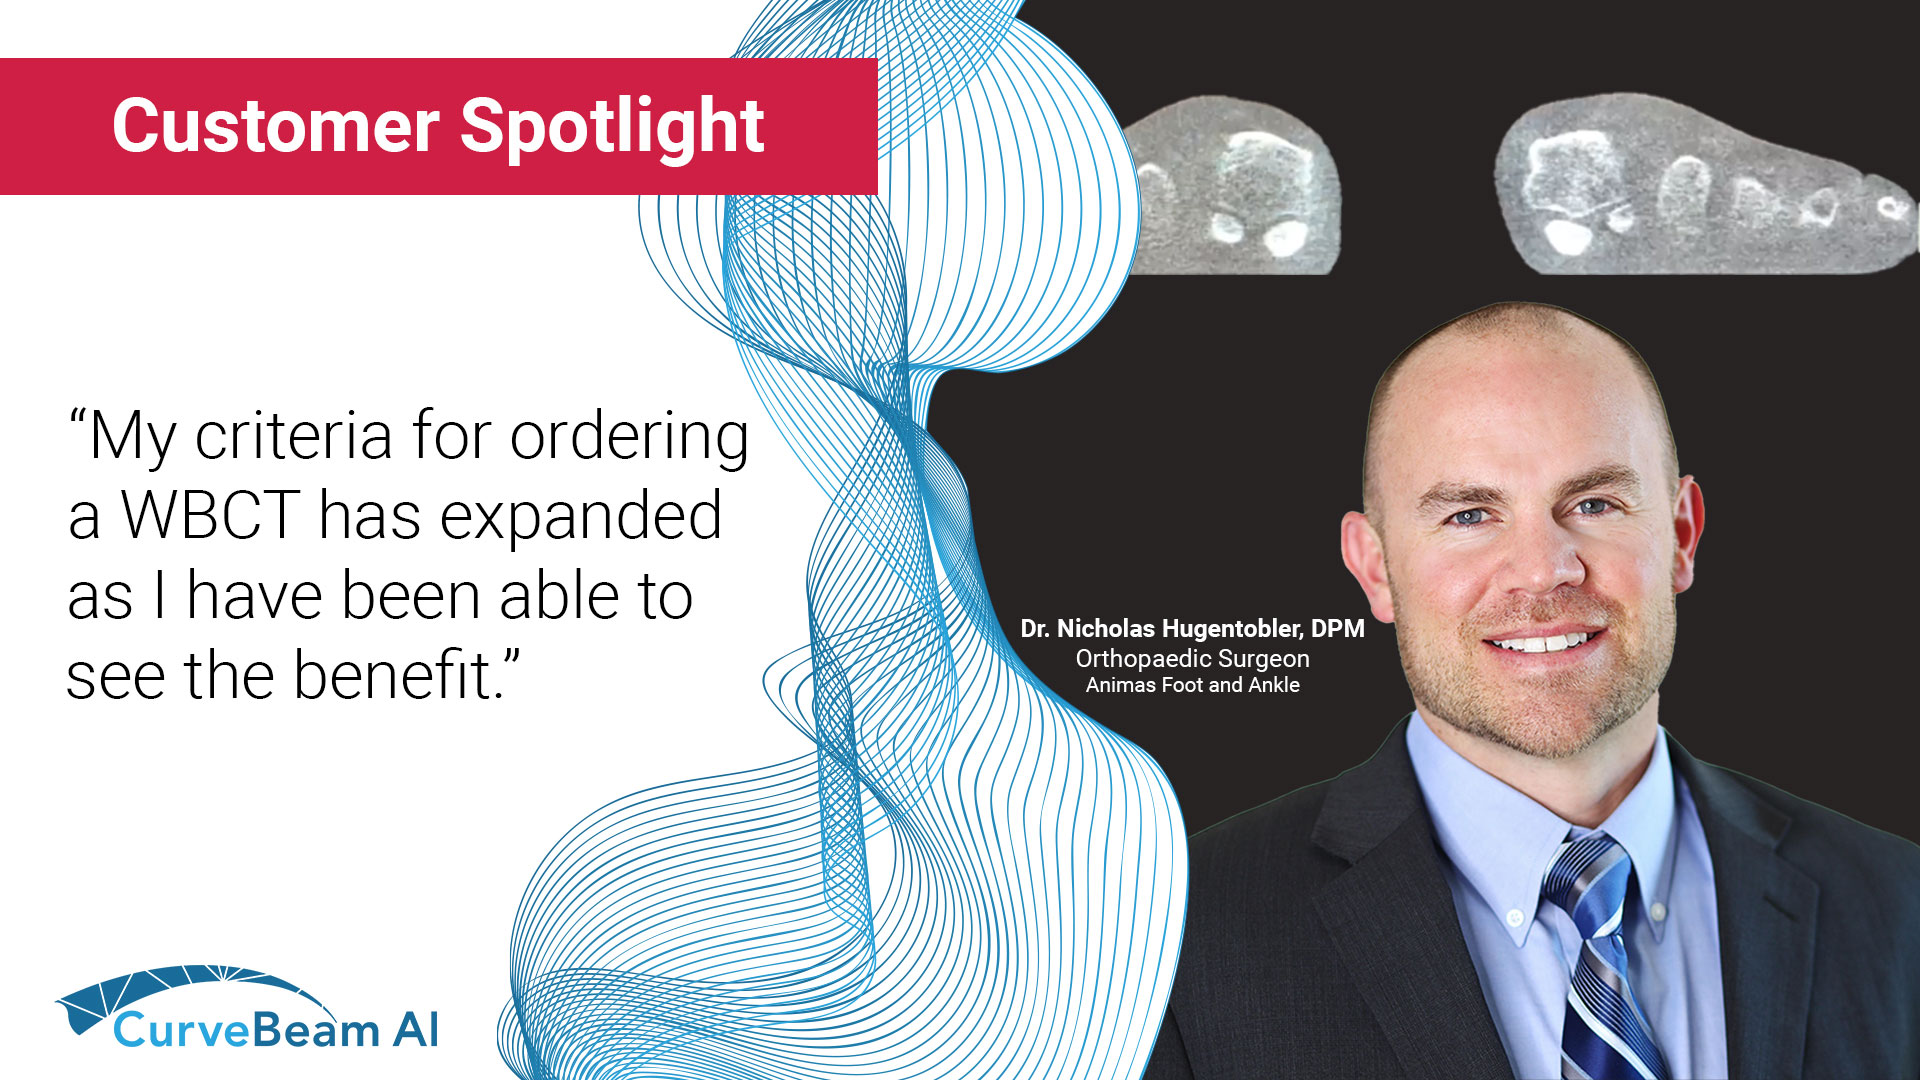
Click here to watch a webinar by Dr. Cristian Ortiz in which he explains a decision table he devised for HV surgical approach after scanning more than 400 HV patients on WBCT.
Related Posts